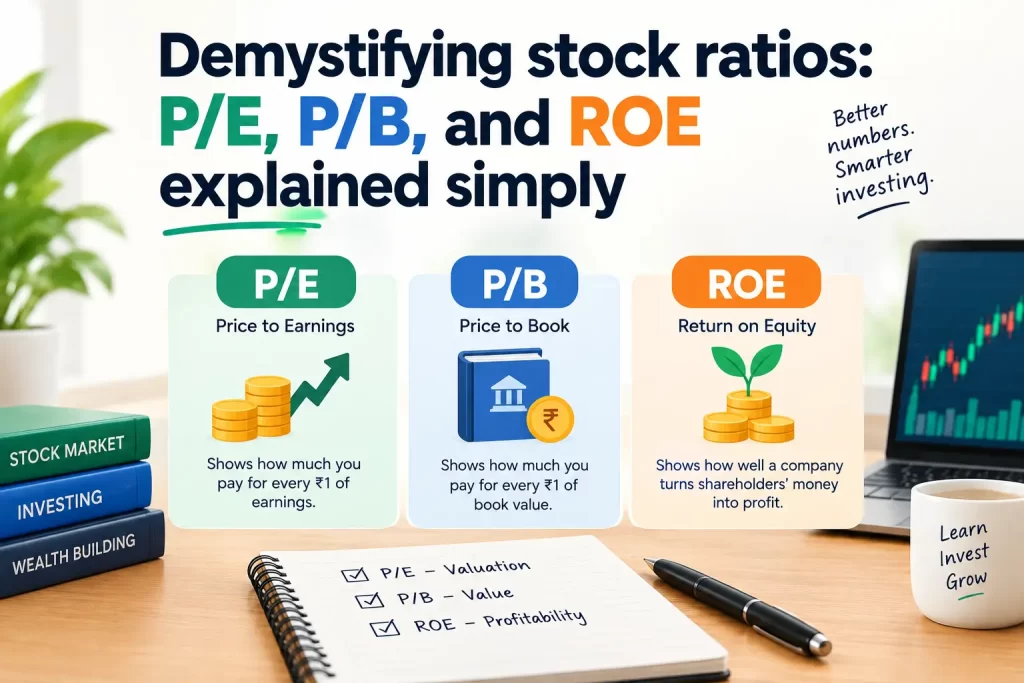
Demystifying stock ratios: P/E, P/B, and ROE explained simply
Open the page for any stock and you get hit with a wall of numbers. P/E 28. P/B 4.5. ROE 19%. For most people, that is where investing starts to feel like a language they never learned, so they skip it and buy whatever a friend recommended instead.
Here is the good news. You do not need all of it. Three ratios do most of the heavy lifting, and once you can read them in plain English, a stock page stops looking like a cockpit dashboard and starts telling you a story. P/E, P/B, and ROE each answer one simple, human question about a company. Let me walk through all three without the jargon.
The short version
- P/E (price to earnings) tells you how expensive a stock is relative to the profit it makes. A rough “how many years of earnings am I paying for” number.
- P/B (price to book) tells you how much you are paying compared to the company’s net assets, the value of what it owns minus what it owes.
- ROE (return on equity) tells you how good the company is at turning shareholders’ money into profit.
- No single ratio means anything on its own. The skill is reading them together, comparing within the same industry, and looking at the trend over several years rather than one snapshot.
- A low P/E is not automatically “cheap,” and a high one is not automatically “overpriced.” Context is everything.
Why these three?
Because between them they answer the three questions any sensible buyer asks. Am I overpaying? That is P/E. What am I actually getting for my money in terms of assets? That is P/B. And is this business any good at making money in the first place? That is ROE.
Miss any one of those and you have a blind spot. A stock can look cheap on P/E and still be a bad buy if the business barely earns a return. It can have a brilliant ROE and still burn you if you pay a wildly inflated price for it. You read them as a set.
P/E ratio: how expensive is the stock?
The price to earnings ratio is the price of one share divided by the earnings per share (EPS), which is simply the company’s annual profit split across all its shares.
Think of it as the price tag on a rupee of profit. If a company earns ₹10 per share in a year and the stock trades at ₹200, the P/E is 20. In plain terms, you are paying ₹200 to own a share that generates ₹10 of profit a year, or 20 times its annual earnings. Loosely, and ignoring growth, that is 20 years of current earnings to earn back your price.
So is a P/E of 20 good? That is the wrong question, and it is the mistake nearly every beginner makes. A P/E only means something in comparison. A high P/E usually means the market expects strong future growth and is willing to pay up for it, which is why fast-growing companies often trade at 40, 50, or higher. A low P/E can mean the stock is cheap, or it can mean the market has good reasons to expect trouble ahead. Cheap and troubled look identical on this one number.
Two rules keep you out of danger here. First, compare a company’s P/E only with its own industry peers and its own history, never with a company in a different sector. A software firm and a steel maker live in different P/E universes for good reasons. Second, know that “trailing” P/E uses the last twelve months of actual profit, while “forward” P/E uses analysts’ estimate of next year’s profit, which is a guess. When you read a P/E, know which one you are looking at.
P/B ratio: what are you paying for the company’s assets?
The price to book ratio compares the share price to the company’s book value per share. Book value is what would theoretically be left for shareholders if the company sold everything it owns and paid off everything it owes. Assets minus liabilities, split across the shares.
An analogy helps. Imagine buying a small shop. Its “book value” is the worth of its stock, fittings, and cash, minus its debts. A P/B of 1 means you are paying exactly that. A P/B of 3 means you are paying three times the value of the shop’s net stuff, presumably because you believe the business can earn far more than its assets alone suggest. A P/B below 1 means you are paying less than the net assets are worth on paper, which sounds like a bargain but often signals the market doubts those assets are really worth their stated value.
Here is the catch that trips people up. P/B is genuinely useful for asset-heavy businesses like banks, insurers, and manufacturers, where the balance sheet is the business. It is close to useless for asset-light companies like IT services, consulting, or consumer brands, whose real value sits in people, software, and brand names that barely show up as “book value” at all. That is why a top IT company can sport a P/B of 8 or 10 and not be expensive in any meaningful sense. Do not judge an asset-light company by a ratio built for asset-heavy ones.
ROE: is the company actually good at making money?
Return on equity is the company’s annual net profit divided by shareholders’ equity (the owners’ money in the business). It answers the most important question of the three: for every rupee that belongs to shareholders, how many paise of profit does the company generate a year?
If a company has ₹1,000 crore of shareholder equity and earns ₹180 crore of profit, its ROE is 18%. That is the return the business is squeezing out of its owners’ capital. A consistently high ROE is the fingerprint of a genuinely good business, one with a real edge that lets it earn more on the same capital than its rivals.
As a loose rule of thumb, an ROE in the mid-teens or higher, sustained over years, is a healthy sign, and single-digit ROE suggests a business that struggles to make its capital work hard. But two warnings matter. Consistency beats a single great year, so look at ROE across five years, not one. And watch out for ROE that is pumped up by heavy debt. A company can borrow aggressively to boost the ratio while quietly becoming fragile, so always read ROE alongside how much debt the company carries.
How the three work together
This is where it gets interesting, because the combination tells you more than any single number.
A high P/E paired with a high, steady ROE often describes a quality company that the market has recognised and priced richly. You are paying up for a good business, and the question becomes whether the price leaves you any room. A low P/E with a low ROE frequently means a stock is cheap for a reason, a mediocre business the market has fairly written down. The one to be most wary of is a high P/E sitting on top of a weak ROE, because you are paying a premium price for a business that has not shown it can earn a strong return. That gap is where a lot of money goes to die.
None of these combinations is a buy or sell signal by itself. They are prompts. They tell you which question to ask next.
Quick reference
| Ratio | Plain-English question | Formula | Best used for |
|---|---|---|---|
| P/E | How expensive is the stock vs its profit? | Share price ÷ earnings per share | Comparing companies in the same industry |
| P/B | How much am I paying vs the company’s net assets? | Share price ÷ book value per share | Banks, insurers, asset-heavy businesses |
| ROE | How well does it turn owners’ money into profit? | Net profit ÷ shareholders’ equity | Judging business quality over time |
Common mistakes beginners make
The first is treating a single ratio as a verdict. A low P/E is a question (“why is this cheap?”), not an answer. The second is comparing across industries, which produces nonsense conclusions, like calling a bank “cheaper” than a software firm because its P/E is lower. The third is looking at one year instead of the trend, which hides whether a good number is a fluke or a pattern. And the fourth is forgetting debt, especially with ROE, where borrowing can flatter the ratio while raising the risk.
How to actually use these
Ratios are a starting point, not a stock-picking machine. Used well, they narrow a huge list of companies down to a handful worth studying properly, and they flag things that need explaining. When you see a ratio that looks unusual, high, low, or out of line with peers, your job is not to react but to ask why, then go read the business behind it.
So compare within the sector, look at several years rather than a snapshot, read the three together, and treat every surprising number as a question to investigate. Do that and you are already ahead of most people, who either ignore the ratios entirely or trust one of them far too much.
A quick note
This article is educational and general in nature. It explains what these ratios mean, not which stocks to buy, and it is not investment advice. Ratios are one input among many, and no formula replaces understanding the business or your own goals and risk tolerance. If you want guidance tailored to your situation, consider speaking with a SEBI-registered investment adviser.
FAQs
What is a good P/E ratio for a stock?
There is no universal “good” number, because it depends entirely on the industry and the company’s growth. A P/E that looks high for a slow-growing manufacturer can look reasonable for a fast-growing tech firm. The useful comparison is against the company’s own industry peers and its own history, not against an absolute benchmark.
What does a P/B ratio below 1 mean?
It means the stock trades for less than the stated value of its net assets. That can indicate a bargain, but it more often reflects the market’s doubt that those assets are truly worth their book value, or expectations of weak future earnings. It is a signal to investigate, not an automatic buy.
What is a good ROE?
As a rough guide, an ROE sustained in the mid-teens or higher over several years suggests a strong business. Consistency matters more than a single high year, and it is important to check whether high ROE is being driven by genuine profitability or by heavy borrowing.
Can I rely on just one of these ratios?
No. Each answers a different question and each has blind spots. P/E ignores asset value, P/B is misleading for asset-light companies, and ROE can be distorted by debt. Reading them together gives a far more reliable picture than any one alone.
Do these ratios work for all companies?
Not equally. P/B is most useful for asset-heavy businesses like banks and least useful for asset-light ones like IT services. P/E is hard to interpret for companies with little or no profit. The ratios are tools with specific strengths, so match the tool to the type of business.