How to Read a Balance Sheet: A Plain-English Guide
The first time you open a company’s balance sheet, it looks like a wall of accounting words designed to keep you out. Non-current liabilities. Reserves and surplus. Deferred tax. Most beginners take one look, decide it is a job for chartered accountants, and go back to reading the share price.
That is a shame, because underneath the jargon a balance sheet is one of the simplest and most honest documents a company produces. It is a snapshot of what a business owns, what it owes, and what is genuinely left over for its owners, all captured on a single day. Learn to read it and you can tell, in a few minutes, whether a company stands on solid ground or is quietly drowning in debt.
This is a plain-English guide to reading a balance sheet: the three parts, the one equation that ties them together, what a healthy one looks like, and the warning signs that should make you pause.
The short version
- A balance sheet is a snapshot of a company’s finances on one specific date, showing what it owns, what it owes, and what belongs to shareholders.
- It is built on one equation: Assets = Liabilities + Equity. It always balances, which is where the name comes from.
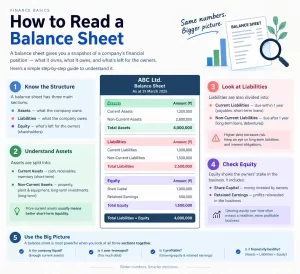
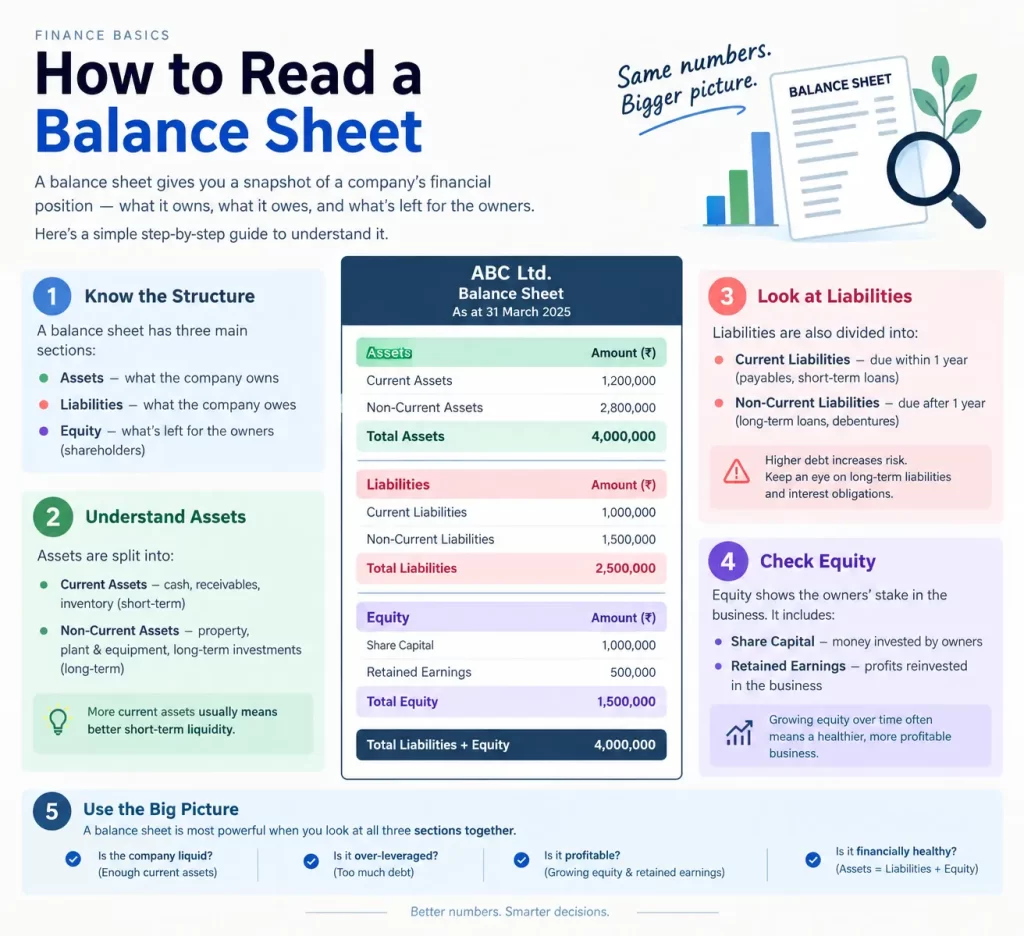
- Assets are what the company owns. Liabilities are what it owes. Equity (also called shareholders’ funds) is what is left for owners after the debts.
- A healthy balance sheet usually has manageable debt, more short-term assets than short-term dues, growing reserves, and real cash rather than just paper value.
- One snapshot means little on its own. The insight comes from comparing several years and reading it alongside the profit and loss and cash flow statements.
What a balance sheet actually is
A balance sheet is a photograph, not a video. It captures a company’s financial position at one frozen moment, usually the last day of a quarter or financial year. It does not tell you how much the company earned over the year (that is the profit and loss statement) or how cash moved through it (that is the cash flow statement). It tells you where things stood on that date.
Everything on it fits into three buckets: assets, liabilities, and equity. And those three are held together by an equation so reliable it gives the document its name:
Assets = Liabilities + Equity
The two sides always match. That is not a coincidence, it is arithmetic. Everything a company owns had to be paid for somehow, either with borrowed money (liabilities) or with the owners’ money (equity). So the value of what it owns must equal the sum of those two sources. If it does not balance, someone made a mistake.
The three parts,
Assets: what the company owns
Assets are everything of value the business controls, from cash in the bank to factories to money customers still owe it. They are usually split into two groups by how quickly they turn into cash.
- Current assets are things expected to become cash within a year. This includes cash itself, short-term investments, inventory (goods waiting to be sold), and receivables (money customers owe but have not paid yet).
- Non-current assets are longer-term holdings the company uses to run the business, like land, buildings, machinery, and long-term investments. You will also see intangible assets here, such as patents, brand value, and goodwill (an accounting figure that appears when a company buys another for more than its net worth).
A quick instinct worth developing: cash is the highest-quality asset, and goodwill is the softest. A balance sheet stacked with goodwill and thin on cash deserves a second look.
Liabilities: what the company owes
Liabilities are the company’s obligations, the claims other people have on its assets. Like assets, they split by timing.
- Current liabilities are dues payable within a year: short-term loans, money owed to suppliers (payables), and expenses accrued but not yet paid.
- Non-current liabilities are longer-term obligations, mainly long-term borrowings like bank loans and bonds that come due beyond a year.
Debt is not automatically bad. Borrowing to build a profitable factory can be smart. The question is always whether the company earns enough to service that debt comfortably, which is something you check by reading this section against the company’s profits.
Equity: what is left for the owners
Equity, often called shareholders’ funds in Indian reports, is what would remain for the owners if the company sold everything and paid off every debt. It is the assets-minus-liabilities figure, and it belongs to the shareholders. Its two main pieces are:
- Share capital, the money originally raised by issuing shares.
- Reserves and surplus, which is mostly retained earnings, the profits the company has kept and reinvested over the years instead of paying out.
Growing reserves year after year is one of the clearest signs of a business that makes money and compounds it. Shrinking reserves, or the alarming case of negative equity (where liabilities exceed assets), tell the opposite story.
The one equation that ties it together
If the three parts feel abstract, here is a homely analogy. Think of buying a flat worth ₹80 lakh. You put in ₹20 lakh of your own money and take a ₹60 lakh home loan.
- The flat is your asset: ₹80 lakh.
- The loan is your liability: ₹60 lakh.
- Your own stake, the equity, is ₹20 lakh.
Assets (₹80 lakh) = Liabilities (₹60 lakh) + Equity (₹20 lakh). A company’s balance sheet is the same idea, just with more line items. Every rupee of stuff it owns was funded either by someone it owes or by its owners, and the sheet simply lays out both sides.
What a healthy balance sheet looks like
Reading the parts is step one. Judging them is where it gets useful. Here is what tends to separate a sturdy balance sheet from a shaky one.
- Manageable debt. The company is not drowning in borrowings relative to its equity. A rough way to check is the debt-to-equity ratio (total debt divided by shareholders’ funds), where lower is generally safer, though what counts as high varies a lot by industry.
- More current assets than current liabilities. The company can cover its short-term dues with its short-term assets, which means it is unlikely to face a cash crunch. The current ratio (current assets divided by current liabilities) captures this, and a value comfortably above 1 is reassuring.
- Growing reserves. Retained earnings that build up over the years signal a business that consistently earns and reinvests profit.
- Real cash, not just paper. Healthy cash balances and receivables that get collected on time beat a sheet inflated by goodwill, ageing inventory, or money customers never seem to pay.
Those first two ratios, by the way, come straight off the balance sheet, and they pair naturally with the profitability ratios like ROE that you read off the profit statement. No single number is a verdict, but together they sketch a company’s financial health quickly.
A simple worked example
Numbers make this click. Imagine a small company, Brightwear Ltd, with this simplified balance sheet at year-end (in ₹ crore).
| Assets | Liabilities and equity | ||
|---|---|---|---|
| Cash and investments | 40 | Payables (suppliers) | 25 |
| Receivables | 30 | Short-term loans | 15 |
| Inventory | 30 | Long-term loans | 40 |
| Property and machinery | 100 | Share capital | 50 |
| Reserves and surplus | 90 | ||
| Total assets | 200 | Total liabilities and equity | 200 |
Here is how to read it in under a minute. Total assets of ₹200 crore balance against ₹80 crore of liabilities (25 + 15 + 40) and ₹120 crore of equity (50 + 90). Current assets (cash, receivables, inventory) add up to ₹100 crore against current liabilities (payables plus short-term loans) of ₹40 crore, so the current ratio is 2.5, which is comfortable. Total debt of ₹55 crore against ₹120 crore of equity gives a debt-to-equity of under 0.5, which is conservative. And reserves of ₹90 crore are large relative to the ₹50 crore of share capital, telling you the company has retained a lot of profit over its life. In plain terms, this is a financially healthy business.
Now imagine the same company but with ₹150 crore of long-term loans and reserves of just ₹10 crore. Suddenly it is heavily indebted and has retained little profit, and the same “snapshot” tells a far more worrying story. The line items did not change, only the amounts, and that is exactly the kind of judgment reading a balance sheet trains you to make.
Red flags to watch
A few patterns should make you slow down and dig deeper.
- Debt rising faster than equity or profits, which suggests the company is leaning ever harder on borrowing.
- Current liabilities larger than current assets, a sign it may struggle to meet near-term obligations.
- Receivables or inventory ballooning year after year, which can mean the company is booking sales it cannot collect or piling up goods it cannot sell.
- A big slice of assets sitting in goodwill or vague intangibles, which is softer value than cash or real property.
- Negative equity, where liabilities exceed assets outright, which is a serious distress signal.
None of these is proof of trouble on its own. Each is a question that sends you to the notes, the cash flow statement, and the company’s history for an answer.
How beginners should actually use it
Do not try to memorise every line. The skill is not recall, it is pattern recognition, and it comes from three habits.
Read the trend, not the snapshot. One year’s balance sheet is a single photo, but three to five years side by side is a story, showing whether debt is creeping up, reserves are growing, and cash is real. Compare within the industry, because a “normal” amount of debt for a bank or an infrastructure firm would look alarming for a software company, and vice versa. And never read the balance sheet alone, since it pairs with the profit and loss statement (which shows whether the company is earning) and the cash flow statement (which shows whether the profit is turning into actual cash). The three together are far more revealing than any one of them.
Get comfortable with those habits and the wall of jargon turns into something genuinely useful: a quick, honest read on whether a company is built to last.
A quick note
This article is general education, not investment advice, and it is not a recommendation to buy or sell any security. Reading a balance sheet is one part of analysing a company, not a complete method, and figures in the example are illustrative. Consider your own goals and, if you want tailored guidance, consult a SEBI-registered investment adviser.
FAQs
What is a balance sheet in simple terms?
A balance sheet is a snapshot of a company’s finances on a single date, showing what it owns (assets), what it owes (liabilities), and what is left over for its owners (equity). It follows one rule: assets always equal liabilities plus equity.
What are the three main parts of a balance sheet?
Assets, which are everything the company owns; liabilities, which are everything it owes; and equity, also called shareholders’ funds, which is what remains for owners after subtracting liabilities from assets.
What does a healthy balance sheet look like?
A healthy balance sheet typically shows manageable debt relative to equity, more current assets than current liabilities, steadily growing reserves, and solid cash rather than value tied up in goodwill or uncollected receivables. Comparing several years matters more than any single snapshot.
What is the difference between the balance sheet and the profit and loss statement?
The balance sheet is a snapshot of financial position on one date, showing assets, liabilities, and equity. The profit and loss statement covers a period of time and shows how much the company earned and spent to arrive at its profit. You need both, plus the cash flow statement, for a full picture.
What is negative equity on a balance sheet?
Negative equity, or negative shareholders’ funds, means a company’s total liabilities exceed its total assets. It is a serious warning sign that usually points to sustained losses or heavy debt, and it warrants careful investigation before considering the stock.